


 Chinese
 Spanish
 French
 Russian
 German
 Portuguese
 Indonesian
 Thai
 Vietnamese
 Arabic


Air bubbles in turbidity measurements can create apparent quality excursions that resemble particle breakthrough. Before replacing a probe, test whether gas entry, pressure changes, or incomplete chamber filling explains the reading. Your investigation must preserve the water's particle content while separating sampling faults from sensor faults.

Air bubbles in turbidity measurements: establish the pattern first
Intermittent high readings can delay commissioning. The supplier sees stable laboratory performance; the skid builder sees pump-start spikes; the operator sees an alarm. Resolve the disagreement with synchronized evidence rather than immediate calibration adjustment.
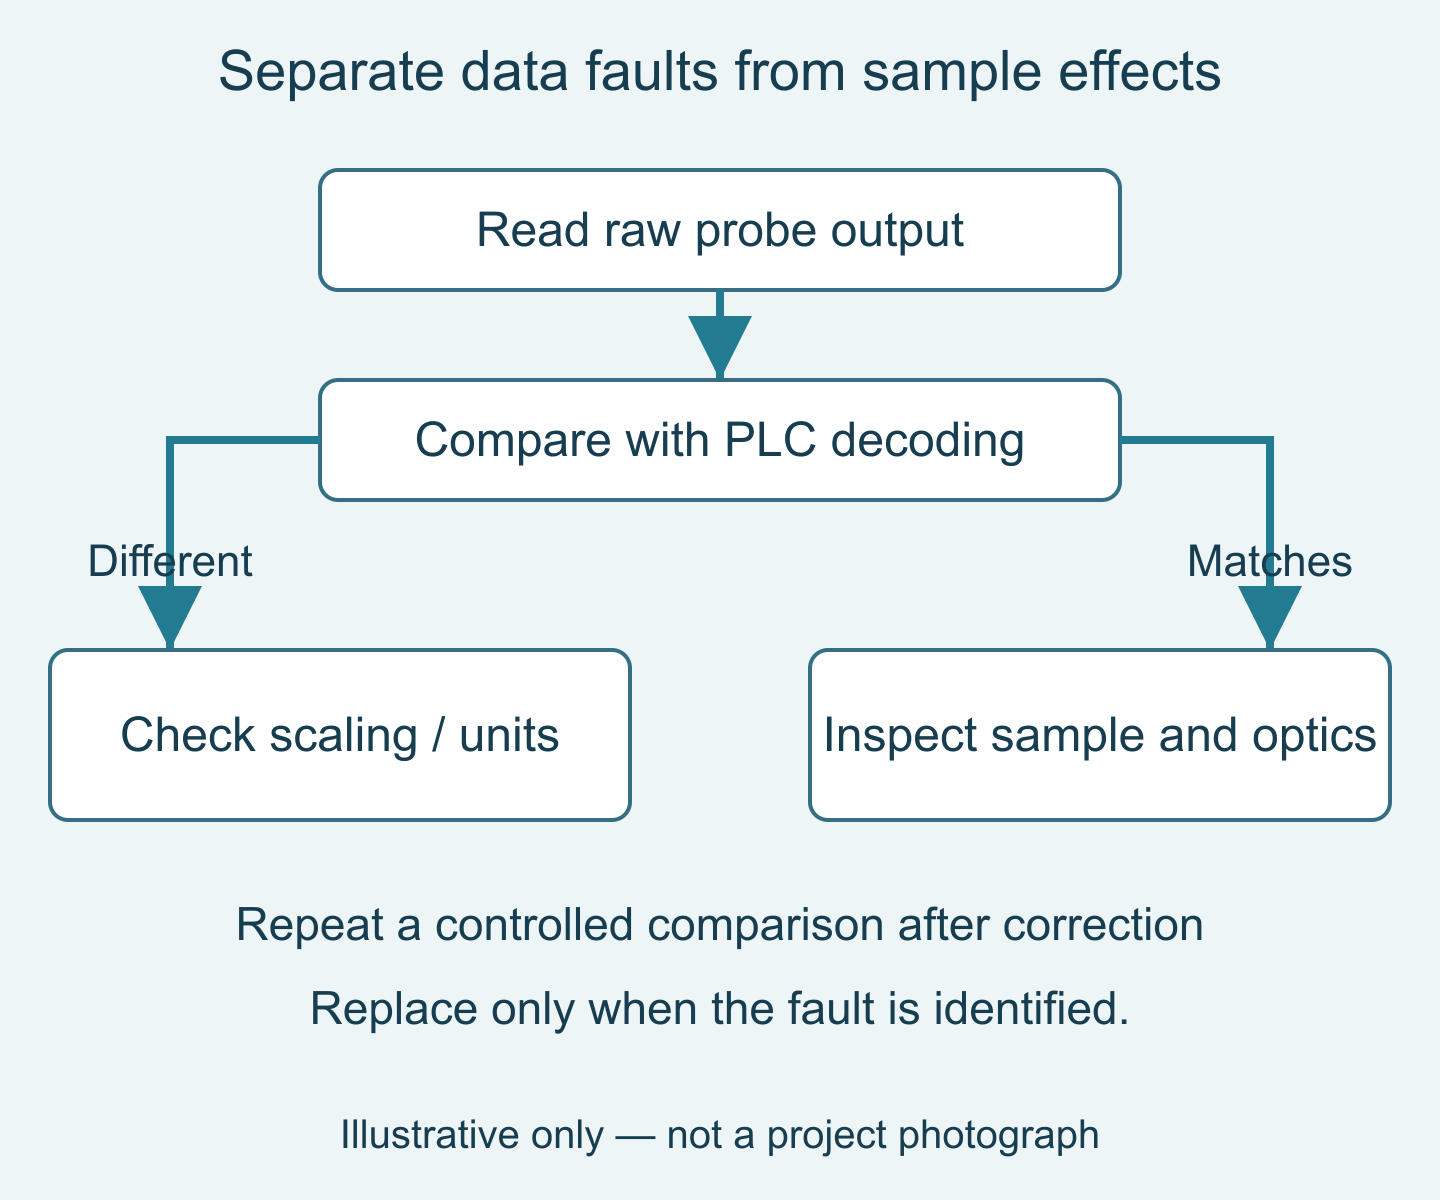
Record whether excursions follow valves, pumps, cleaning, or pressure changes. Compare raw probe output, read through a supported service tool or compatible transmitter, with the PLC interpretation. These probes are not assumed to have built-in displays. A mismatch directs attention to scaling or communications before water quality.
Bubbles can scatter light, but a spike is not proof of bubbles. Actual solids, optical fouling, nearby reflective surfaces, unstable sample flow, and data-handling errors can produce overlapping symptoms. Keep the initial diagnosis open until a controlled check changes one suspected cause and produces a repeatable response.
Trace where gas can enter or emerge
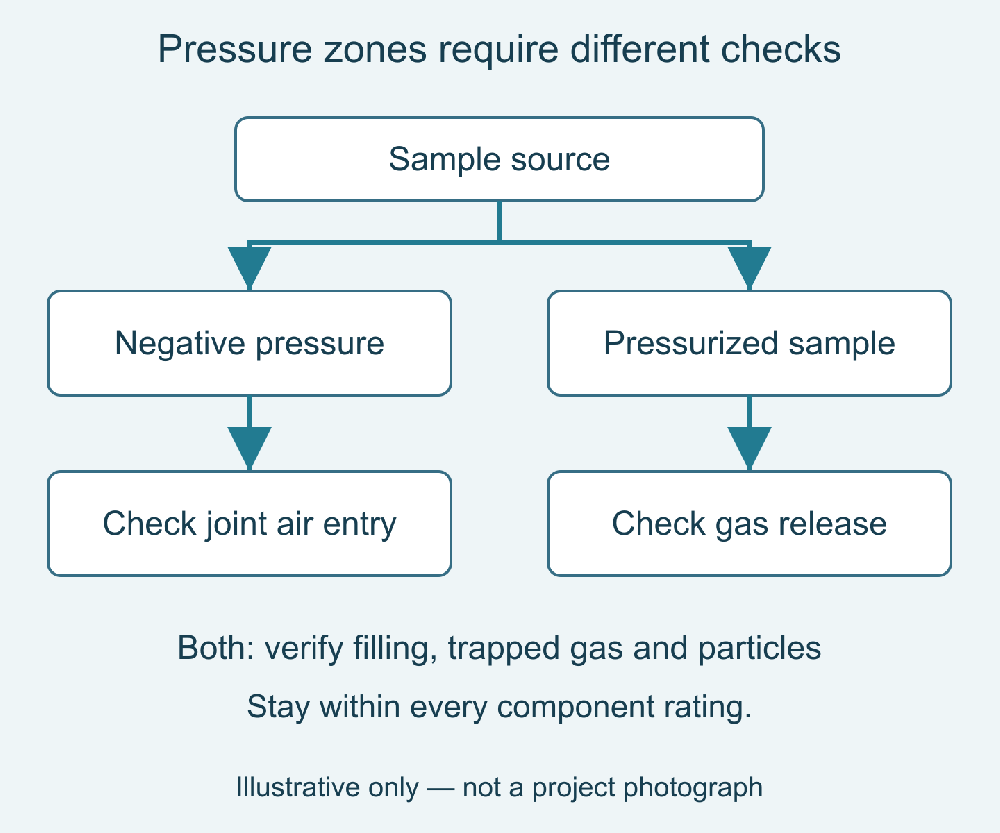
On a suction or negative-pressure sample line, inspect joints for air ingress. On a pressurized line, investigate pressure-release effects and gas trapped at high points rather than assuming every joint draws air inward. Check chamber filling. Any transparent inspection section needs suitable pressure and material ratings.
Pressure reduction can release dissolved gas even when no external leak is visible. Map the pressure drop from process connection to drain and identify valves or restrictions near the measurement location. Any modification must remain within the ratings of the sensor and every associated fitting. Never close a discharge simply to force a stable reading.
Temperature changes and sampling residence time also matter. Water that warms in a long exposed tube may not behave like water at the process connection. Shortening unnecessary tubing can improve representativeness, but routing changes should retain safe access, drainage, and the flow conditions required by the selected assembly.
| Check in sequence | Result to interpret | Next action |
|---|---|---|
| 1. Compare raw output and PLC decoding | A mismatch suggests a data-path error | Correct units or register interpretation first |
| 2. Correlate spikes with pump and pressure events | Coincidence suggests, but does not prove, gas effects | Inspect filling and the relevant pressure zone |
| 3. Correct one sampling defect safely | Repeatable improvement supports that cause | Verify with unchanged particle conditions |
| 4. Inspect optics and compare representative water | Persistent disagreement needs further investigation | Test fouling and sensor performance before replacement |
Run a controlled comparison before recalibration
Use representative water from the same process condition and an agreed comparison method. Align sample collection with the online record, allowing for transport delay. Record how the sample was handled. An open container left standing can lose bubbles and allow particles to settle, so a lower later reading does not isolate the cause by itself.
Change one factor at a time where safe: eliminate an identified air-entry point, restore chamber filling, or adjust the sample arrangement within its approved limits. Keep the sample source and operating condition otherwise stable. Repeat the check to establish whether the intervention explains the result rather than merely coinciding with a process change.
If a bubble-management chamber is proposed, assess its effect on particles and response time. A device that removes bubbles but also changes the sampled solids population may produce a smoother yet less representative measurement. Require performance evidence for the intended water and flow conditions, not just a clean demonstration with a different sample.
Separate optical cleaning from bubble management
A cleaning brush addresses material attached to the optical surface. It is not a substitute for a correctly designed sample path. The YexSensor YEX-S2-ZS-8S provides a brush-equipped turbidity option; it should not be purchased on the assumption that mechanical wiping removes the cause of gas-related interference.
The YEX-S1-TS digital turbidity sensor is another option where accessible cleaning and the required measurement performance suit the project. Changing series without addressing the sampling fault can reproduce the same symptom. Select the model after establishing the cause and the maintenance requirement.
| Specification or function | Verified configuration | Engineering consequence |
|---|---|---|
| YEX-S1-TS interface | RS485 Modbus RTU | Verify host register interpretation |
| YEX-S2-ZS-8S interface | RS485 Modbus RTU; optional 4–20 mA | Order the required output configuration explicitly |
| Supply for these models | 12–24 V DC | Check voltage at the connected instrument |
| S2 range options | 0–20 / 0–200 / 0–1000 / 0–4000 NTU | Select the range for the decision level |
| S2 0–20 NTU error limit | ±3% of reading or ±1.5 NTU, whichever is greater | Not proof of tight sub-NTU accuracy |
| S2 operating envelope | 0–60°C; below 0.2 MPa | Keep tests within rated conditions |
| YEX-S2-ZS-8S cleaning | Built-in brush | Addresses optical deposits, not upstream gas entry |
S2 figures follow its user manual; they are not S1 specifications. Error limits still apply after removing bubbles. At 1 NTU, the S2 0–20 NTU specification is governed by ±1.5 NTU, not display resolution. Review accuracy versus resolution; select another performance class for tighter low-level acceptance.
Apply the checks to the actual project
Filter outlet monitoring after a pressure change
The challenge is distinguishing particle breakthrough from gas released along the bypass. Correlate the trend with filter state and pressure conditions, then inspect the path from takeoff to drain. The integrated solution may require sampling corrections rather than a new probe. The value is a defensible diagnosis before an unnecessary vessel shutdown or instrument replacement.
Aerated process water transferred to a monitoring point
The challenge is entrained gas combined with genuine suspended material. Avoid assuming that all variability is interference. Compare the proposed location with a representative alternative under controlled conditions and document any delay. The value is a measurement that retains relevant process changes while reducing avoidable sampling artifacts.
Packaged monitoring panels commissioned on site
The challenge is that factory testing may not reproduce site pressure, tubing length, or pump cycling. Include sample-path checks in site acceptance and preserve the raw trend during troubleshooting. The value is clear responsibility between sensor supplier, panel builder, and commissioning contractor when the delivered system behaves differently from the factory demonstration.
Protect data integrity while the fault is investigated
Do not conceal recurring excursions with averaging before understanding them. Smoothing can delay a genuine alarm. If temporarily applied, retain raw data and record the setting so comparisons remain meaningful.
For Modbus integration, verify address, baud rate, parity, register type, scaling, and units against the delivered documentation. Mark stale or invalid readings explicitly. A held value following a communication interruption should not look like stable water. If analog output is used, verify the configured span and host scaling separately from the optical measurement.
Agree how cleaning and maintenance affect data validity. Keep timestamps for operator interventions and identify the test interval in the record. The objective is not a visually quiet trend; it is a traceable measurement that supports the customer's operational decision under known conditions.
Decide whether to repair the installation or replace the instrument
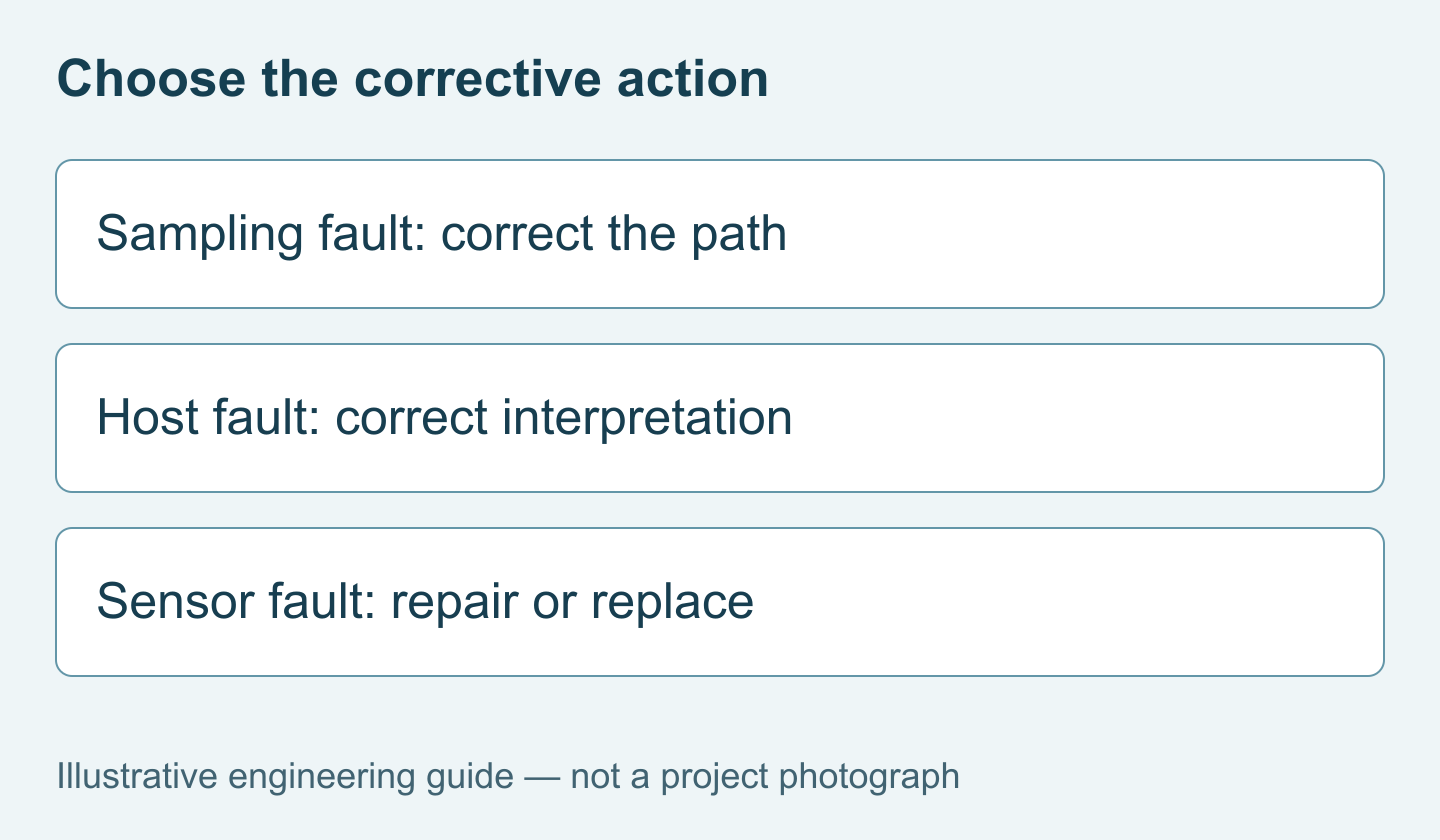
Replace a component when inspection, verification, or a controlled comparison identifies a component problem. Correct the sample path when the error follows the sampling arrangement. Escalate unresolved cases with evidence covering operating conditions, reference method, observed symptoms, and interventions. A short synchronized record is more useful than several unrelated photographs of a high number.
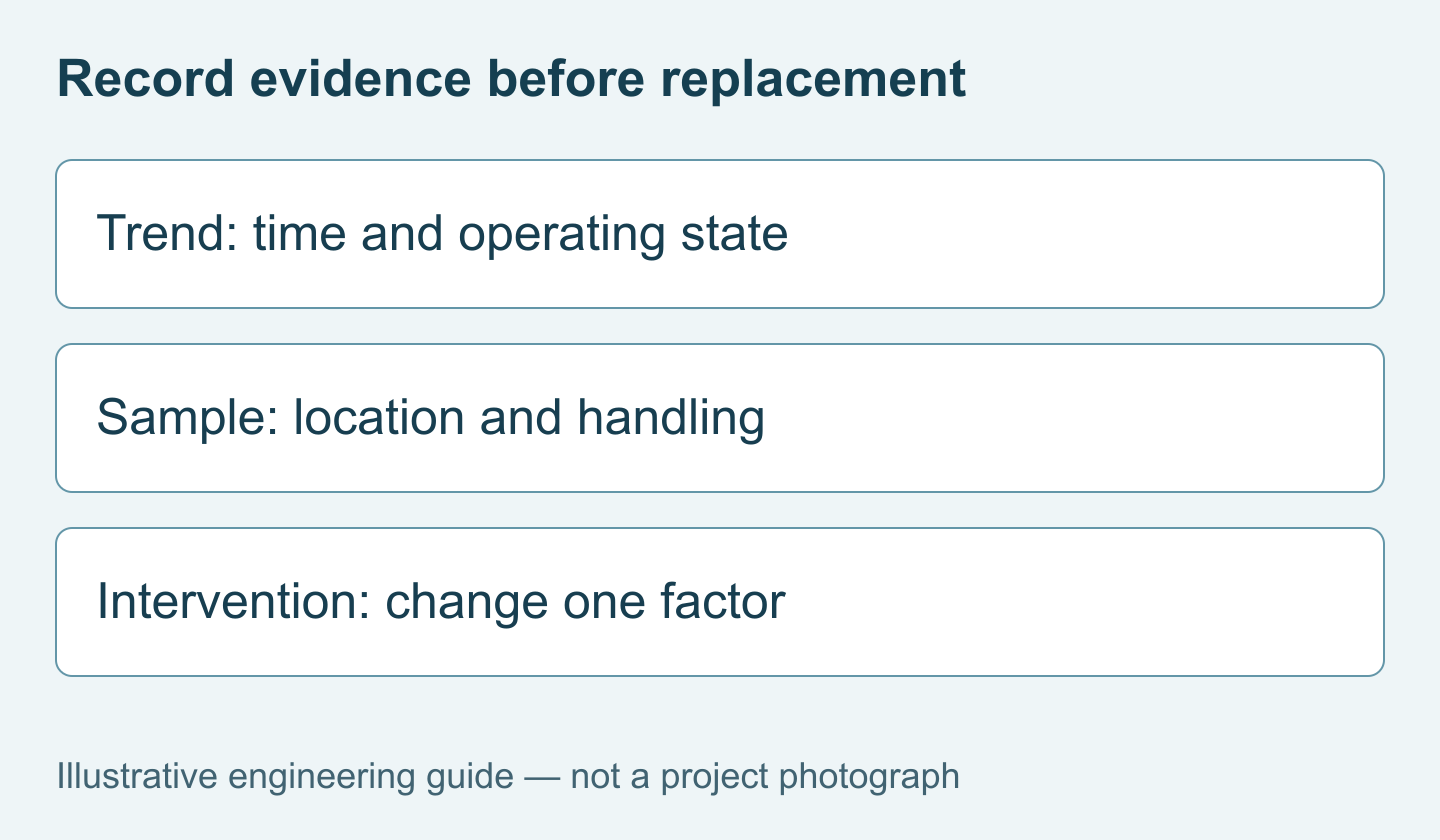
For a replacement review, provide water type, normal and abnormal readings, sample pressure and routing, bubble observations, cleaning history, reference results, host interface, and quantity. Compare the S2 brush-equipped configuration only against identified requirements, then Send Your Project Requirements for a model-specific assessment.
FAQ
Q1. Do air bubbles always increase the turbidity reading?
They can create additional light scattering and unstable or elevated readings, but the observed response depends on the measurement geometry and sample conditions. Air bubbles in turbidity measurements should therefore be investigated rather than assumed from a spike alone. Document the operating event and use controlled checks before deciding that the probe needs recalibration or replacement.
Q2. Why can clear-looking water produce intermittent high readings?
Visible clarity does not exclude small particles or gas-related interference at the measurement point. Compare the online trend with pump operation, pressure changes, and sample handling. Also check the PLC's interpretation of the instrument value. Purchase decisions should follow evidence from a representative comparison, not an assumption that apparently clear water must produce a particular number.
Q3. Will a cleaning brush remove the bubble problem?
Not reliably. The brush on a suitable sensor removes deposits from its optical surface; it does not repair a leaking connection or prevent gas release elsewhere in the sample path. Specify automatic cleaning when fouling creates a maintenance requirement. Treat bubble management as a separate installation question with its own verification and acceptance conditions.
Q4. Should I choose a different range to reduce bubble sensitivity?
Changing range is not a substitute for correcting a sampling problem. Choose range and accuracy for the normal operating envelope, credible excursions, and decision threshold. Then validate the installation. A wider span or altered display increment may change how the disturbance looks without establishing that the underlying measurement has become representative or suitable for control.
Q5. Is an immersed sensor preferable to a bypass arrangement?
It depends on access, water representativeness, and the process environment. Immersion avoids some sample-line effects but may place the optics near aeration or difficult maintenance conditions. A bypass improves accessibility but adds transport and pressure changes. Compare the complete arrangements and their service requirements rather than treating either mounting method as universally free of interference.
Q6. Can a bubble trap be added to any sampling panel?
No universal arrangement can be assumed suitable. Check pressure rating, flow conditions, drainage, materials, delay, and whether particles are retained or altered. The complete sampling assembly must preserve the measurement objective. Ask the panel supplier to explain and verify its design with representative water before adding the device to a standardized bill of materials.
Q7. What evidence should accompany a technical support request?
Send the exact model and configuration, time-stamped trend, installation photographs, sample routing, operating conditions, and comparison method. Include the sequence of changes already attempted and their results. This allows the supplier and integrator to distinguish a product issue from a sampling or host-system issue without repeating unstructured tests that consume commissioning time and replacement stock.
Q8. Can stronger averaging make the system acceptable?
Only if the resulting response still meets the documented project requirement and the cause of variability is understood. Averaging can conceal short genuine excursions and delay alarms. Retain raw data during evaluation, compare both signals against the required response, and obtain agreement on the final setting. A smooth display alone is not an acceptance criterion.
Q9. What should a replacement quotation include?
It should identify the model, measurement performance, output configuration, accessories, and installation assumptions. Ask whether sampling modifications are included or excluded and how acceptance will be demonstrated. Confirm service items, delivery arrangements, and warranty terms separately. A replacement sensor quote should not imply that an unresolved sample-path problem has already been diagnosed or will automatically disappear.
Summary
Investigate bubbles by linking the turbidity trend to gas entry, pressure changes, chamber filling, and operating events. Preserve representative particles during comparison tests, and verify host data before recalibration. Choose S1 or brush-equipped S2 according to verified measurement and maintenance needs; neither choice replaces sound sample design. For procurement, distinguish a sensor replacement from a sampling-system correction and agree the evidence needed for acceptance. The useful outcome is a traceable, representative signal, not simply a quieter trend.


