
Ammonia Nitrogen Is a Warning Signal for Water Pollution
Ammonia nitrogen is one of the most important water pollution indicators because it links organic pollution, nitrogen conversion, oxygen depletion and biological toxicity. When ammonia nitrogen rises, operators need to know whether the source is wastewater discharge, aquaculture loading, biofilter stress or abnormal source water.
In public water protection, ammonia nitrogen events can create drinking water difficulty, odor, eutrophication and downstream treatment cost. In aquaculture, ammonia stress can weaken animals and increase disease risk, especially when pH and temperature make the toxic fraction higher.
Online monitoring helps environmental managers and plant operators move from delayed sampling to early warning. Continuous NHN data can trigger inspection, aeration review, water exchange, process adjustment or compliance investigation.
How Ammonia Nitrogen Affects Oxygen, Toxicity and Eutrophication
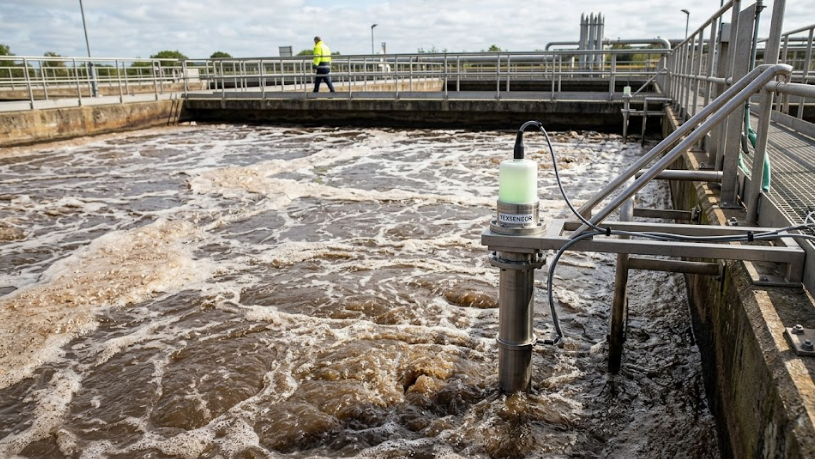
YEX-S1-NHN uses an ammonium ion-selective electrode based on PVC membrane technology. The sensor measures ammonium ion activity and applies temperature compensation to provide a fast, economical and integration-ready online value.
Ammonia nitrogen is also a major oxygen-consuming pollutant. Oxidation of NH4+-N consumes dissolved oxygen, which can darken and degrade water, stress aquatic organisms and interfere with normal ecological function.
Nitrogen compounds can also drive eutrophication. Excess nitrogen supports algal growth, shortens filter operating cycles, increases treatment cost, creates taste and odor problems and can contribute to oxygen deficit when algae decay.
Where Online NHN Data Supports Decisions
In wastewater plants, NHN monitoring supports nitrification control, aeration adjustment and effluent warning. It should be reviewed together with DO, pH, temperature and flow.
In rivers, lakes and source water stations, ammonia nitrogen trends help identify pollution events and nutrient pressure. Remote monitoring is useful when the site is difficult to sample frequently.
In aquaculture, ammonia nitrogen data helps operators adjust feeding, aeration, water exchange and biofilter management before fish or shrimp show obvious stress.

Key Specification and Procurement Parameters
The table below summarizes the project parameters that should be confirmed during purchasing, design review and commissioning. It is written for engineering comparison, PLC integration and site acceptance rather than for consumer-level product browsing.
| Parameter | YEX-S1-NHN online ammonium nitrogen sensor | Project meaning |
|---|---|---|
| Housing material | ABS, PVC and POM | Suitable for water quality monitoring installations |
| Measurement principle | Ion-selective electrode method | Direct ammonium ion monitoring |
| Ranges | 0-10.00 mg/L, 0-100.00 mg/L, 0-1000.0 mg/L | Select range according to water matrix and risk |
| Resolution | 0.01 mg/L or 0.1 mg/L, temperature 0.1 C | Supports trend and alarm design |
| Accuracy | Reading +/-10% or +/-1 mg/L for low range; reading +/-10% for high range, temperature +/-0.5 C | Acceptance should consider concentration band |
| Response time | T90 less than 60 s | Useful for real-time warning |
| Minimum detection limit | 0.09 mg/L for 0-10 and 0-100 mg/L ranges; 0.9 mg/L for 0-1000 mg/L | Defines low-level monitoring capability |
| Output | RS-485 Modbus RTU, optional 4-20 mA | Connects to PLC, RTU and online platform |
| Working condition | 0-40 C, pressure <0.1 MPa, pH 4-10 | Defines installation boundary |
| Installation | Immersion, 3/4 NPT, IP68 | Suitable for tanks, ponds and monitoring stations |
Selection and Integration Guide
Select the range by expected concentration. Source water and aquaculture often need low-range sensitivity, while industrial wastewater may need wider range and stronger validation.
Measure pH and temperature together with ammonia nitrogen. The operational risk of ammonia depends strongly on these conditions, so NHN alone should not be interpreted in isolation.
For long-term deployment, plan electrode activation, cleaning and periodic calibration. Ion-selective electrodes are practical, but they need disciplined maintenance in fouling water.
Define whether the value is used for alarm, process control or reporting. Each use requires different validation frequency and tolerance.
Procurement, Acceptance and Lifecycle Control
For a commercial online ammonia nitrogen monitoring project, the purchase should be defined as a monitoring loop, not as a loose probe. The deliverable should include the sensor, mounting method, sample condition, cable route, waterproof connection, power supply, communication protocol, register map, engineering unit, alarm thresholds, calibration materials, spare parts and acceptance method.
The first design question is what the ammonia nitrogen value will decide. A value used for chemical dosing, aerator control, disinfection review, pond management, discharge warning or maintenance planning needs a different sampling point and alarm strategy from a value used only for operator reference.
A good site survey records the water matrix, expected concentration range, temperature range, pressure, flow, fouling level, accessibility, cabinet location, safety restrictions and maintenance owner. These details decide whether the online value remains stable after the commissioning team leaves.
System integrators should standardize Modbus address rules, baud rate, parity, register scaling, dashboard label, alarm delay, maintenance hold and communication fault status. Standardization is especially important when one platform manages multiple ponds, treatment units, factories or remote stations.
Acceptance should include a trend period, not only one comparison reading. Operators should confirm that the value responds logically to process changes, remains stable during normal conditions and can be compared with a laboratory or portable reference under the same water condition.
The dashboard should show the current value, trend, unit, alarm state, sensor status, last maintenance date and related equipment. A clean operations screen is more useful than a crowded engineering page when staff need to respond quickly.
Documentation should include installation photos, wiring diagram, Modbus register map, calibration procedure, cleaning method, spare part list, alarm settings and acceptance records. These documents protect the project when staff change or when the system is expanded later.
Maintenance should be visible in the data history. Cleaning, calibration, electrode activation, cap replacement or sensor removal should be recorded so that a maintenance event is not misread as a real water quality event.
Long-term value comes from correlating ammonia nitrogen with flow, temperature, dosing state, aeration state, rainfall, feeding load, production schedule and laboratory records. A connected monitoring system explains why a value changed, not only that it changed.
Procurement teams should also define after-sales responsibility before startup. The plant should know who owns routine cleaning, who checks calibration, who keeps spare parts, who manages platform accounts and who calls for technical support when the trend becomes abnormal.
For retrofit projects, the integrator should review old cable routes, grounding, cabinet space and controller inputs before quoting. Many measurement problems are caused by weak electrical installation rather than by the sensing principle itself.
For new projects, the monitoring loop should be included in factory acceptance and site acceptance checklists. The checklist should verify sensor output, scaling, alarm output, trend storage, communication recovery after power cycling and maintenance mode.
When ammonia nitrogen data is reviewed in monthly operation meetings, it becomes a management signal. Teams can compare abnormal events, maintenance notes, laboratory values and process actions to improve water quality control instead of using the instrument only as a display.
The project team should define data ownership before the system is handed over. Operators usually need real-time alarms and simple maintenance prompts, managers need trend summaries and exception reports, and engineers need raw values and configuration records. If all users see the same crowded screen, the monitoring project becomes harder to use than it needs to be.
Cyber and access management should be considered for cloud-connected or remote stations. Password policy, gateway access, user roles, data export permission and remote configuration authority should be documented. Water quality systems may look simple, but a wrong remote setting can affect dosing, aeration or alarm response.
For plants with formal quality systems, the online value should be linked to a calibration and verification record. The record should show who performed the check, what reference was used, what the before-and-after value was and whether any process action was taken. This supports audits and helps the team distinguish instrument drift from real process change.
For EPC and OEM projects, spare parts should be quoted with realistic service intervals rather than left to later negotiation. Caps, electrodes, standards, cleaning materials, waterproof connectors and one critical spare sensor can reduce downtime when the monitoring value is tied to production or compliance.
The communication design should include failure behavior. If the PLC loses a sensor, the system should show a communication fault and use a defined fallback mode instead of freezing the last value as if it were still valid. A visible fault is safer than a normal-looking stale value.
Training should be performed with the actual installed equipment. Operators should practice entering maintenance mode, removing the sensor safely, cleaning the sensing area, reinstalling it, confirming the trend and clearing alarms. A short practical training session often prevents months of avoidable service calls.
The first seasonal change after startup should be reviewed carefully. Temperature, rainfall, production load, algae activity, disinfectant demand or wastewater composition can change the baseline. Adjusting alarm thresholds after real seasonal data is normal engineering optimization.
Finally, the commercial value of online ammonia nitrogen monitoring should be measured by avoided risk and improved decisions. Fewer emergency site visits, earlier warnings, lower chemical waste, more stable discharge quality, better animal health or clearer maintenance planning are stronger success metrics than the number of sensors installed.
A useful handover meeting should include the owner, integrator, electrical contractor and operation team. Each party should confirm what was installed, which values are used for control, which values are only advisory and what action is expected for each alarm level. This prevents the common problem where a monitoring system is technically online but operationally ownerless.
The historical trend should be reviewed at several time scales. Minute-level data helps diagnose noise, mixing and response time; daily data shows operating cycles; monthly data shows drift, seasonality and process improvement. A project that stores data but never reviews it loses much of the value of online monitoring.
When the sensor is part of a dosing or equipment control loop, the control output should be tested under simulated abnormal conditions before handover. The team should verify high alarm, low alarm, communication loss, maintenance mode and power recovery. These tests are small, but they reveal whether the system will behave correctly during a real event.
Commercial buyers should ask suppliers to explain both the measurement principle and the site limitations. A responsible specification will mention pressure, temperature, pH boundary, flow condition, fouling risk, calibration needs and communication requirements. This level of detail makes comparison between quotations more meaningful.
| Integration item | Recommended practice | Risk if ignored |
|---|---|---|
| Range selection | Choose concentration range by application | Low values may be missed or high values may exceed range |
| pH and temperature | Monitor together with NHN | Toxicity risk may be misread |
| Activation | Soak electrode in clean water before use as required | Initial readings may be unstable |
| Data correlation | Review with DO, flow, feeding or wastewater load | The cause of ammonia change remains unclear |
| Maintenance | Clean PVC membrane gently and calibrate when needed | Long-term drift reduces trust |
Maintenance and Data Quality Management
Before testing, remove protective caps and activate the measuring and reference electrodes in clean water as required. Long-stored electrodes should not be placed directly into critical service without stabilization.
If the PVC membrane becomes semi-transparent or covered with deposits, rinse with distilled or deionized water. Avoid silicone grease, protein solution and harsh mechanical abrasion.
Dry storage is suitable for long-term non-use when the sensing element is protected. Before returning to service, the electrode should be activated and checked against a suitable reference.
FAQ
Q1 Why test ammonia nitrogen in water?
Because it indicates pollution, oxygen consumption, eutrophication risk and toxicity to aquatic organisms.
Q2 Is ammonia nitrogen harmful to fish?
Yes. Elevated ammonia can be toxic, especially when pH and temperature increase the toxic ammonia fraction.
Q3 How does ammonia affect dissolved oxygen?
Oxidation of ammonium consumes dissolved oxygen and can contribute to oxygen deficit.
Q4 Can ammonia cause eutrophication?
Yes. Nitrogen nutrients can promote algae growth, which later creates oxygen and treatment problems.
Q5 What does YEX-S1-NHN measure?
It measures ammonium nitrogen using an ion-selective electrode with temperature compensation.
Q6 Can the sensor connect to a PLC?
Yes. It supports RS-485 Modbus RTU and optional 4-20 mA output.
Q7 What other parameters should be monitored?
pH, temperature, DO, flow and sometimes nitrite should be reviewed together with ammonia nitrogen.
Q8 Where is online NHN monitoring used?
Wastewater plants, source water stations, rivers, lakes, aquaculture ponds and industrial discharge monitoring.
Summary
Ammonia nitrogen testing is essential for pollution control, water treatment and aquaculture safety. It reveals nitrogen loading, oxygen demand, eutrophication pressure and potential toxicity.
YEX-S1-NHN gives integrators an online ammonium nitrogen monitoring option with ion-selective electrode technology, Modbus RTU communication, optional 4-20 mA output and field-ready installation.


