
Dissolved Oxygen Is the Limiting Factor in Aquaculture
All oxygen-consuming aquatic animals need dissolved oxygen to survive, grow and reproduce. In water, available oxygen is much lower and more variable than in air, so dissolved oxygen becomes one of the most important limiting factors in aquaculture production.
Traditional management often responds after fish or shrimp show floating-head behavior. That approach treats aeration as an emergency measure. Modern farms need online DO monitoring to prevent low oxygen stress before visible symptoms appear.
Dissolved oxygen management is not simply keeping oxygen as high as possible. Excessive aeration wastes energy, while insufficient aeration damages growth, immunity and survival. The goal is controlled oxygen based on real water conditions.
DO Sources, Consumption and Pond Variation
Dissolved oxygen enters ponds through phytoplankton photosynthesis, artificial aeration and natural air-water exchange. Oxygen is consumed by animal respiration, plant and microbial respiration, organic matter oxidation and chemical oxidation-reduction processes.
DO changes daily. In ponds without artificial aeration, surface DO often rises during daylight due to photosynthesis and reaches a high point in the afternoon, then falls through the night until early morning.
DO also changes seasonally and vertically. High temperature reduces oxygen solubility, salinity reduces saturation and deep ponds may show lower oxygen near the bottom where photosynthesis is weak and oxygen consumption continues.
Online DO Data for Aeration and Farm Decisions
In pond aquaculture, online DO sensors can warn of night-time oxygen decline, guide aerator start time, reduce unnecessary aeration and support emergency response during hot, rainy or windless weather.
In high-density farms, DO data should be reviewed with feeding, biomass, water temperature, algae condition and ammonia nitrogen. Low DO can worsen harmful substance conversion and reduce animal resistance to stress and disease.
In remote or multi-pond systems, DO sensors connected through RTU or gateway platforms allow managers to prioritize ponds by risk and document oxygen conditions throughout the production cycle.

Key Specification and Procurement Parameters
The table below summarizes the project parameters that should be confirmed during purchasing, design review and commissioning. It is written for engineering comparison, PLC integration and site acceptance rather than for consumer-level product browsing.
| Parameter | YexSensor fluorescence DO sensor">YexSensor fluorescence DO sensor | Project meaning |
|---|---|---|
| Measurement principle | YexSensor fluorescence DO sensor">Fluorescence dissolved oxygen | No oxygen consumption and lower maintenance than electrolyte probes |
| Range | 0-20.00 mg/L or 0-200% saturation at 25 C | Suitable for ponds, surface water and treatment tanks |
| Resolution | 0.01 mg/L, temperature 0.1 C | Supports fine trend analysis and alarm deadband setting |
| Accuracy | +/-2%, temperature +/-0.3 C | Reliable for aquaculture control and remote monitoring |
| Response time | T90 less than 30 s | Supports fast low-oxygen warning |
| Compensation | Automatic temperature and salinity compensation settings | Improves reporting across freshwater and brackish water |
| Output | RS-485 Modbus RTU | Integrates with RTU, PLC, gateway and cloud platform |
| Installation | Immersion, 3/4 NPT, IP68 | Field-ready for ponds, tanks and channels |
Selection and Integration Guide
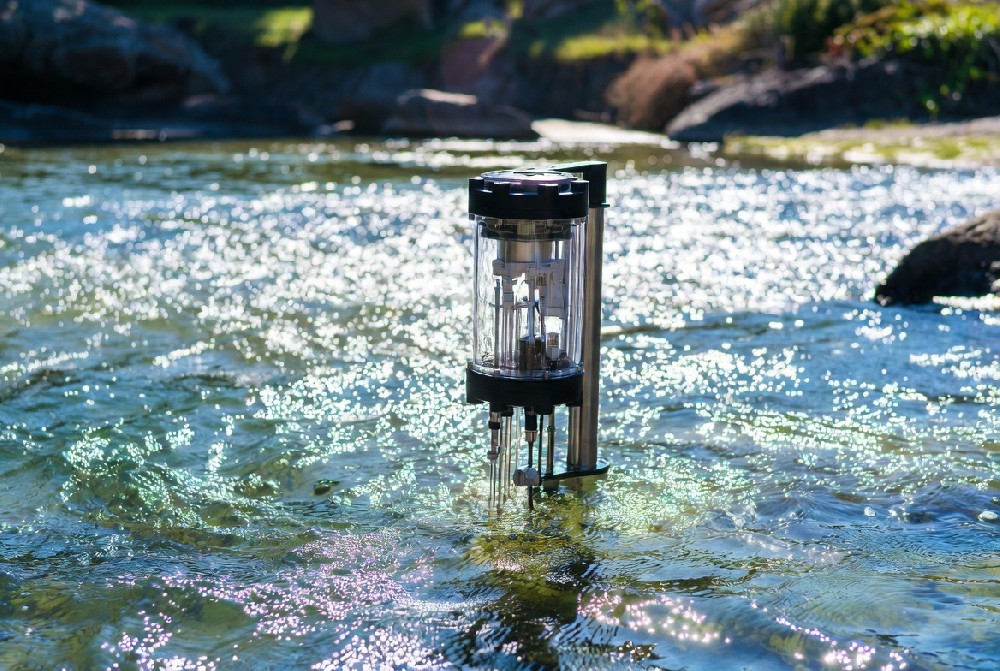
Select fluorescence DO for long-term aquaculture monitoring because it does not consume oxygen and has lower routine maintenance than electrolyte probes.
Install the probe at a representative depth and away from direct aerator bubbles. Bubble impact can create unstable readings that look like real oxygen changes.
Set alarms by species, biomass, water temperature and farm response time. A warning alarm, aerator start threshold and critical alarm should be separated.
Use DO trend to manage aeration economics. Turning aerators on only as emergency equipment is risky, but running them without data can waste power.
Procurement, Acceptance and Lifecycle Control
For a commercial aquaculture dissolved oxygen monitoring project, the purchase should be defined as a monitoring loop, not as a loose probe. The deliverable should include the sensor, mounting method, sample condition, cable route, waterproof connection, power supply, communication protocol, register map, engineering unit, alarm thresholds, calibration materials, spare parts and acceptance method.
The first design question is what the dissolved oxygen value will decide. A value used for chemical dosing, aerator control, disinfection review, pond management, discharge warning or maintenance planning needs a different sampling point and alarm strategy from a value used only for operator reference.
A good site survey records the water matrix, expected concentration range, temperature range, pressure, flow, fouling level, accessibility, cabinet location, safety restrictions and maintenance owner. These details decide whether the online value remains stable after the commissioning team leaves.
System integrators should standardize Modbus address rules, baud rate, parity, register scaling, dashboard label, alarm delay, maintenance hold and communication fault status. Standardization is especially important when one platform manages multiple ponds, treatment units, factories or remote stations.
Acceptance should include a trend period, not only one comparison reading. Operators should confirm that the value responds logically to process changes, remains stable during normal conditions and can be compared with a laboratory or portable reference under the same water condition.
The dashboard should show the current value, trend, unit, alarm state, sensor status, last maintenance date and related equipment. A clean operations screen is more useful than a crowded engineering page when staff need to respond quickly.
Documentation should include installation photos, wiring diagram, Modbus register map, calibration procedure, cleaning method, spare part list, alarm settings and acceptance records. These documents protect the project when staff change or when the system is expanded later.
Maintenance should be visible in the data history. Cleaning, calibration, electrode activation, cap replacement or sensor removal should be recorded so that a maintenance event is not misread as a real water quality event.
Long-term value comes from correlating dissolved oxygen with flow, temperature, dosing state, aeration state, rainfall, feeding load, production schedule and laboratory records. A connected monitoring system explains why a value changed, not only that it changed.
Procurement teams should also define after-sales responsibility before startup. The plant should know who owns routine cleaning, who checks calibration, who keeps spare parts, who manages platform accounts and who calls for technical support when the trend becomes abnormal.
For retrofit projects, the integrator should review old cable routes, grounding, cabinet space and controller inputs before quoting. Many measurement problems are caused by weak electrical installation rather than by the sensing principle itself.
For new projects, the monitoring loop should be included in factory acceptance and site acceptance checklists. The checklist should verify sensor output, scaling, alarm output, trend storage, communication recovery after power cycling and maintenance mode.
When dissolved oxygen data is reviewed in monthly operation meetings, it becomes a management signal. Teams can compare abnormal events, maintenance notes, laboratory values and process actions to improve water quality control instead of using the instrument only as a display.
The project team should define data ownership before the system is handed over. Operators usually need real-time alarms and simple maintenance prompts, managers need trend summaries and exception reports, and engineers need raw values and configuration records. If all users see the same crowded screen, the monitoring project becomes harder to use than it needs to be.
Cyber and access management should be considered for cloud-connected or remote stations. Password policy, gateway access, user roles, data export permission and remote configuration authority should be documented. Water quality systems may look simple, but a wrong remote setting can affect dosing, aeration or alarm response.
For plants with formal quality systems, the online value should be linked to a calibration and verification record. The record should show who performed the check, what reference was used, what the before-and-after value was and whether any process action was taken. This supports audits and helps the team distinguish instrument drift from real process change.
For EPC and OEM projects, spare parts should be quoted with realistic service intervals rather than left to later negotiation. Caps, electrodes, standards, cleaning materials, waterproof connectors and one critical spare sensor can reduce downtime when the monitoring value is tied to production or compliance.
The communication design should include failure behavior. If the PLC loses a sensor, the system should show a communication fault and use a defined fallback mode instead of freezing the last value as if it were still valid. A visible fault is safer than a normal-looking stale value.
Training should be performed with the actual installed equipment. Operators should practice entering maintenance mode, removing the sensor safely, cleaning the sensing area, reinstalling it, confirming the trend and clearing alarms. A short practical training session often prevents months of avoidable service calls.
The first seasonal change after startup should be reviewed carefully. Temperature, rainfall, production load, algae activity, disinfectant demand or wastewater composition can change the baseline. Adjusting alarm thresholds after real seasonal data is normal engineering optimization.
Finally, the commercial value of aquaculture dissolved oxygen monitoring should be measured by avoided risk and improved decisions. Fewer emergency site visits, earlier warnings, lower chemical waste, more stable discharge quality, better animal health or clearer maintenance planning are stronger success metrics than the number of sensors installed.
A useful handover meeting should include the owner, integrator, electrical contractor and operation team. Each party should confirm what was installed, which values are used for control, which values are only advisory and what action is expected for each alarm level. This prevents the common problem where a monitoring system is technically online but operationally ownerless.
The historical trend should be reviewed at several time scales. Minute-level data helps diagnose noise, mixing and response time; daily data shows operating cycles; monthly data shows drift, seasonality and process improvement. A project that stores data but never reviews it loses much of the value of online monitoring.
When the sensor is part of a dosing or equipment control loop, the control output should be tested under simulated abnormal conditions before handover. The team should verify high alarm, low alarm, communication loss, maintenance mode and power recovery. These tests are small, but they reveal whether the system will behave correctly during a real event.
Commercial buyers should ask suppliers to explain both the measurement principle and the site limitations. A responsible specification will mention pressure, temperature, pH boundary, flow condition, fouling risk, calibration needs and communication requirements. This level of detail makes comparison between quotations more meaningful.
| Integration item | Recommended practice | Risk if ignored |
|---|---|---|
| Sensor depth | Install at representative water depth | Surface value may hide bottom oxygen stress |
| Aerator logic | Use threshold, delay and manual override | Equipment may cycle or fail to respond |
| Weather response | Review DO before storms, hot nights and sudden wind changes | Hypoxia events may occur at night |
| Data context | Combine DO with temperature, feeding and ammonia | Cause of oxygen change remains unclear |
| Maintenance | Clean cap and inspect biofilm regularly | False low or slow readings |
Maintenance and Data Quality Management
Clean the optical cap gently and avoid scratching it. In algae-rich ponds, biofilm can grow quickly and should be removed before the trend becomes unreliable.
Build a normal daily DO baseline for each pond. This baseline helps distinguish expected day-night cycling from abnormal oxygen consumption or sensor fouling.
Record aerator operation and power failures in the monitoring platform. DO data is most useful when staff can see what equipment action occurred at the same time.
FAQ
Q1 Why is dissolved oxygen critical in aquaculture?
It supports animal respiration, microbial decomposition, harmful substance reduction and disease resistance.
Q2 When is DO usually lowest in ponds?
It is often lowest before sunrise because photosynthesis stops at night while oxygen consumption continues.
Q3 Can too much aeration be a problem?
Excessive aeration wastes energy and may disturb pond management, so aeration should be based on data.
Q4 What causes DO to fall?
Animal respiration, microbial activity, organic matter decomposition, high temperature, stratification and cloudy weather can reduce DO.
Q5 What DO level is commonly required?
A common fishery guideline is above 5 mg/L for much of the day and not below 3 mg/L at any time, though species and local standards matter.
Q6 Why use fluorescence DO?
It does not consume oxygen, has lower maintenance and performs well in low-flow pond conditions.
Q7 Can DO sensors control aerators?
Yes, when connected to a PLC or controller with proper fault handling and manual override.
Q8 How does YexSensor support aquaculture DO monitoring?
YexSensor fluorescence DO sensors provide Modbus RTU output, IP68 installation and practical integration for pond and remote monitoring systems.
Summary
Dissolved oxygen management is a production and risk-control task in aquaculture. Online DO monitoring helps farms prevent hypoxia, manage aeration cost and understand pond oxygen dynamics.
YexSensor fluorescence DO sensors support data-driven aeration control through stable online measurement, digital communication and field-ready installation for ponds and aquaculture systems.


