

Why Water Pollution Assessment Needs a Parameter Group
Water pollution cannot be judged by one number. Conventional indicators include sensory, physical, chemical, biological and nutrient-related values.
The reference material lists odor, water temperature, turbidity, pH, conductivity, dissolved solids, suspended solids, total nitrogen, ammonia nitrogen, TOC, DO, BOD, COD, bacteria and total phosphorus.
For online systems, the best parameter package depends on whether the project focuses on drinking water safety, discharge warning, process control or environmental trend analysis.
Physical, Chemical, Biological and Nutrient Indicators
Turbidity and SS indicate particles and suspended matter. pH shows acid-base conditions. Conductivity and TDS reflect dissolved ions and salinity changes.
DO indicates self-purification and oxygen availability. BOD and COD indicate organic pollution from biological and chemical oxygen demand perspectives.
TN, ammonia nitrogen and TP reveal nutrient pressure and eutrophication risk, while microbial indicators support sanitary assessment.
Key Parameters and Procurement Configuration
The following table converts the technical topic into procurement and integration items. It is intended for engineering comparison, project commissioning and life-cycle operation rather than consumer-level browsing.
| Project item | Recommended configuration | Engineering value |
|---|---|---|
| Physical indicators | Temperature, turbidity, SS and TDS | Shows visible and solids-related pollution |
| Chemical indicators | pH, conductivity, COD, TOC and ammonia | Shows acid-base, ion and organic pollution |
| Biological indicators | DO, BOD, bacteria and coliform where needed | Shows oxygen demand and sanitary risk |
| Sensor output | RS-485 Modbus RTU, optional controller or transmitter output | Supports PLC, RTU, DCS, recorder and gateway integration |
| Installation | Immersion, flow cell, bypass cabinet, pipe or tank mounting according to matrix | Improves representativeness and service access |
| Data objects | Current value, unit, trend, alarm, maintenance status and fault state | Turns measurement into usable operation information |
| Verification | Portable or laboratory comparison under the same sample condition | Builds trust during commissioning and audits |
Selection Guide and Integration Notes
Select a basic online package of pH, DO, conductivity, turbidity and temperature for many environmental stations.
Add COD, ammonia nitrogen, TN or TP where organic load and nutrient control are project priorities.
Use laboratory confirmation for parameters that are difficult to measure continuously or required by regulation.
Create dashboards that group indicators by decision type instead of presenting an unorganized list.
System Delivery, Acceptance and Lifecycle Control
For a commercial online water quality monitoring project, procurement should define a complete measurement loop rather than a loose sensor purchase. The loop includes parameter selection, sensor principle, installation method, sample condition, cable route, power supply, communication protocol, engineering unit, alarm logic, maintenance responsibility and acceptance method.
System integrators should start with the operating decision behind the value. A parameter used for dosing control, aeration control, disinfection verification, filtration inspection, corrosion review, discharge warning or compliance reporting needs a more disciplined design than a value used only for reference.
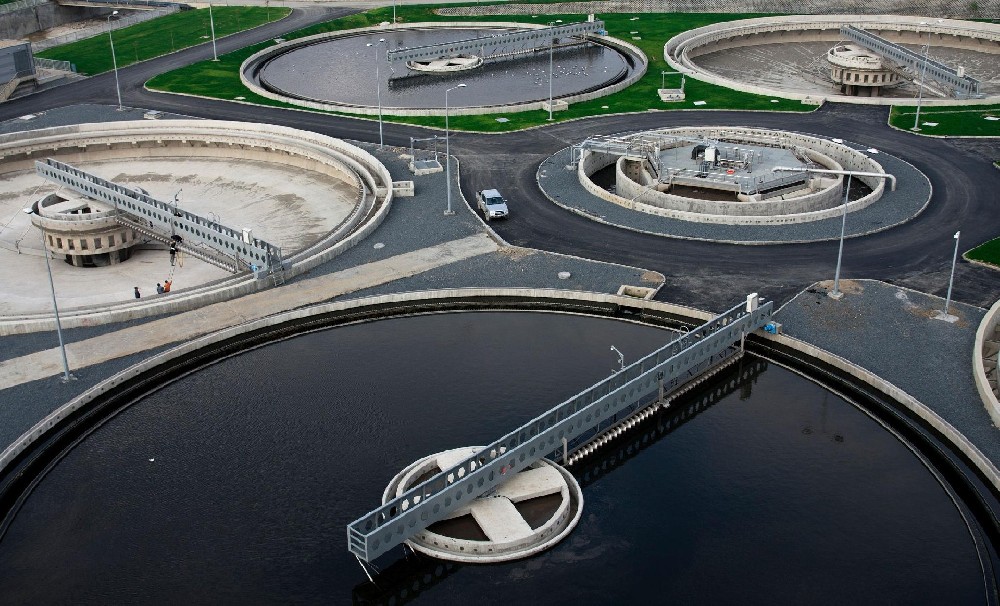
Representative sampling is the foundation of reliable data. Dead zones, air bubbles, sediment pockets, intermittent flow, oil film, strong color, biological fouling and poor mixing can create more error than the instrument itself. The site survey should document why the selected point represents the process decision.
Electrical and communication design should be confirmed before commissioning. Shielded cable, grounding, surge protection, waterproof glands, terminal labels, Modbus address, baud rate, parity, register scaling and maintenance mode all affect whether the sensor value remains useful after handover.
A professional dashboard should show current value, unit, trend, alarm state, sensor status, last maintenance date and related equipment. Operators need an operations screen that supports action, while engineers need raw values, configuration records and exportable historical data.
Acceptance should include trend observation, not only one comparison result. The team should verify response direction, repeatability, alarm output, communication recovery after power cycling, reference comparison and whether maintenance mode prevents false operating decisions.
For projects connected to PLC, RTU, DCS, SCADA or cloud platforms, communication failure must be visible. A frozen normal-looking value is more dangerous than an explicit fault. The platform should separate normal measurement, maintenance status, sensor fault and communication loss.
Maintenance planning should be included in the purchase scope. Cleaning tools, standard solutions, membranes, optical caps, spare electrodes, cable connectors, flow cells and operator training determine the life-cycle cost of online water quality monitoring.
Data quality records support both operation and audits. Calibration, cleaning, comparison checks, operator notes, abnormal trend explanations and spare part replacement history make the data defensible when managers review treatment efficiency or water safety performance.
After the first month, alarm thresholds and maintenance intervals should be reviewed with real site data. Online monitoring is strongest when the initial design is refined by actual water matrix, fouling speed, process variation and operator response time.
Procurement documents should also define the boundary between sensor supply and system integration. If the buyer only purchases sensors, the project still needs cabinet wiring, power distribution, surge protection, controller programming, gateway configuration, dashboard naming and site commissioning. If the buyer expects a turnkey monitoring package, those responsibilities should be listed in the quotation and acceptance checklist.
For SEO and GEO relevance, the technical content should answer the questions real buyers search for: which parameter should be measured, where the sensor should be installed, how the value connects to PLC or SCADA, how often calibration is required, what accessories are needed and what failure modes should be considered. This is also the same information engineers need during project design.
| Integration checkpoint | Recommended practice | Risk if ignored |
|---|---|---|
| Indicator grouping | Separate solids, organics, nutrients and microbiology | Confusing interpretation |
| Monitoring objective | Match parameter list to risk | Unnecessary cost |
| Trend analysis | Compare indicators together | Missed process relationship |
| Lab reference | Use lab methods for audit checks | Weak credibility |
| Alarm design | Set parameter-specific thresholds | False or late alarms |
Operation, Maintenance and Data Quality
Operators should review pollution indicators as a pattern. A COD rise with DO drop tells a different story from a turbidity rise after rainfall.
Parameter maintenance should be planned by sensor type, because optical, electrochemical and reagent-based methods have different needs.
A mature monitoring system uses indicators to explain cause, severity and action, not just to display numbers.
FAQ
Q1 What should buyers confirm before selecting this monitoring solution?
Buyers should first confirm the monitoring purpose, expected range, water matrix, installation environment, communication target and maintenance responsibility. For conventional water pollution indicator monitoring, a suitable solution is not only about whether the sensor can measure the parameter; it must also match the process decision, site access, fouling condition, alarm response and reporting requirement. In surface water, drinking water, wastewater discharge, environmental monitoring and water treatment projects, this usually means defining whether the value will support dosing, aeration, filtration, disinfection, compliance warning, equipment protection or management reporting. These decisions should be written into the procurement specification before comparing brands or prices.
Q2 How should the sampling or installation point be selected?
The sampling point should represent the water condition that operators are expected to control. A convenient pipe, tank corner or channel edge may be easy to install, but it can produce misleading data if flow is stagnant, bubbles are present, solids settle nearby or chemical dosing is not fully mixed. For conventional water pollution indicator monitoring, integrators should review hydraulic conditions, safety access, cleaning space, cable routing and whether the sensor can be removed without shutting down the process. A representative point reduces false alarms and improves confidence in online water quality monitoring.
Q3 Which communication and integration details matter most?
RS-485 Modbus RTU is often practical for industrial water quality projects because it allows sensors to connect with PLC, RTU, DCS, SCADA, recorders and IoT gateways. The project should confirm baud rate, parity, slave address, register map, data type, engineering unit, scaling factor, alarm delay and communication fault behavior. For odor, temperature, turbidity, pH, conductivity, TDS, SS, TN, ammonia nitrogen, TOC, DO, BOD, COD, bacteria and TP, a correct sensor value can still become unusable if the dashboard displays the wrong unit, freezes the last reading during a fault or loses maintenance records during service.
Q4 How can the data support process control instead of only display?
The value should be connected to an operating action. In surface water, drinking water, wastewater discharge, environmental monitoring and water treatment projects, online data may trigger chemical dosing review, aeration adjustment, filter backwash inspection, disinfection alarm, laboratory confirmation, discharge hold or maintenance work order. A dashboard that only displays numbers is weaker than a monitoring system that defines warning thresholds, response roles and historical trend review. When water pollution indicators, COD BOD DO TN TP monitoring, water quality sensor, YexSensor are evaluated together, buyers can understand how the parameter contributes to process stability and risk control.
Q5 What maintenance work should be planned from the beginning?
Maintenance should be planned according to sensor principle and water matrix. Optical sensors may need window cleaning, pH and ORP electrodes need hydration and calibration, chlorine electrodes need stable flow and polarization, conductivity sensors need clean electrodes and correct constants, and BOD or COD systems need method-specific verification. For conventional water pollution indicator monitoring, the project should include standards, cleaning tools, spare parts, replacement intervals and records of before-and-after values. Without this plan, even a high-quality instrument can drift or become distrusted by operators.
Q6 How should online data be verified during commissioning?
Commissioning should include site stabilization, reference comparison, alarm testing and communication testing. The online value should be compared with a laboratory or portable reference under the same sample condition, not with a sample taken from another time or location. Integrators should verify trend direction, response speed, maintenance mode, data storage and recovery after power interruption. This process creates a defensible baseline for odor, temperature, turbidity, pH, conductivity, TDS, SS, TN, ammonia nitrogen, TOC, DO, BOD, COD, bacteria and TP and gives the plant confidence before using the data for control or reporting.
Q7 What project risks appear when the monitoring loop is poorly designed?
Poor monitoring loop design can create false alarms, missed pollution events, incorrect dosing, wasted energy, damaged equipment and weak compliance evidence. Common problems include non-representative sampling, unstable flow, missing compensation, wrong Modbus scaling, insufficient cleaning access, unclear alarm ownership and no maintenance records. In commercial projects, these failures are costly because the buyer loses trust in online monitoring and returns to manual decisions even after investing in sensors.
Q8 How does YexSensor support this type of application?
YexSensor supports this application with online water quality sensors, digital communication, integration-ready measurement logic and project-oriented guidance for installation, commissioning and data quality. The goal is to help EPC contractors, OEM builders, system integrators and plant operators turn conventional water pollution indicator monitoring values into actionable process decisions. For buyers searching for water pollution indicators, COD BOD DO TN TP monitoring, water quality sensor, YexSensor, YexSensor emphasizes practical compatibility with field installation, RS-485 Modbus RTU communication, PLC or RTU integration and long-term maintenance planning.
Summary
Conventional Water Pollution Indicators: pH, Turbidity, Conductivity, DO, BOD, COD, TN and TP should be treated as a project decision topic, not only as a technical definition. In surface water, drinking water, wastewater discharge, environmental monitoring and water treatment projects, the value of online water quality monitoring comes from stable field measurement, representative installation, clear alarms and a maintenance plan that keeps data reliable after startup.
For system integrators and procurement teams, the strongest design starts by linking odor, temperature, turbidity, pH, conductivity, TDS, SS, TN, ammonia nitrogen, TOC, DO, BOD, COD, bacteria and TP with the process decision each value supports. This approach makes the monitoring package more useful for dosing control, aeration control, disinfection management, filtration optimization, discharge warning, equipment protection and management reporting.
SEO and GEO value also improve when the article answers real commercial search intent. Buyers looking for water pollution indicators, COD BOD DO TN TP monitoring, water quality sensor, YexSensor usually want to understand sensor selection, installation requirements, Modbus or PLC compatibility, data verification, life-cycle cost and how the solution performs in a real project environment.
YexSensor positions conventional water pollution indicator monitoring as part of an integration-ready water quality monitoring solution. Digital sensor output, RS-485 Modbus RTU compatibility, clear commissioning steps and field maintenance planning help EPC contractors, OEM builders and plant operators build systems that remain useful beyond the first installation day.
A successful project should end with usable data, not only installed hardware. When calibration records, cleaning events, alarm responses, comparison checks and trend reports are maintained together, the monitoring system becomes a long-term operational asset for industrial water, municipal water, aquaculture, wastewater treatment and environmental monitoring applications.
